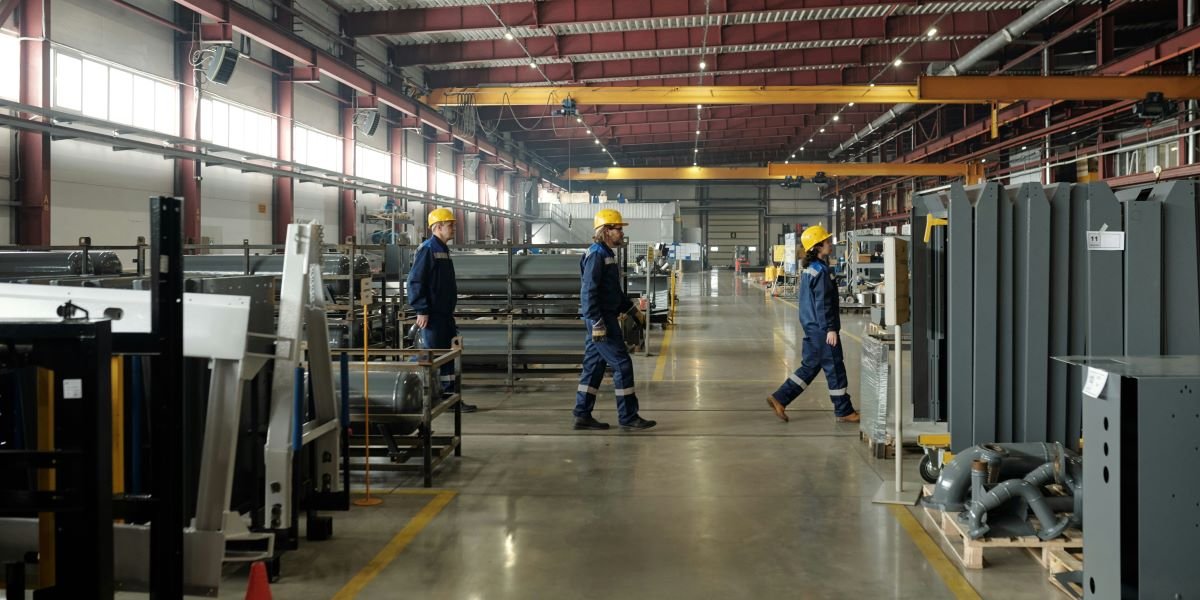
The Institute for Supply Management’s Manufacturing PMI rose to 55.6% in July 2026, up 2.3 percentage points from June’s 53.3% and well above the 53.9% consensus estimate, marking the seventh consecutive month of manufacturing expansion and the strongest reading since May 2022. All five headline components of the index registered in expansion territory for the first time during the current growth cycle. The Employment Index climbed to 52.8%, crossing into expansion after 33 consecutive months of contraction, a signal that manufacturers are adding workers at an accelerating pace and one that introduces a new variable into the Federal Reserve’s already complicated rate decision calculus for September.
- Production surged 6.3 points to 58.5%, its highest level since November 2021, indicating a meaningful ramp-up in factory output.
- New Orders rose to 56.7% from 56.0%, marking the seventh consecutive month of order growth; Backlog of Orders jumped to 55.0% from 50.5%, suggesting demand is beginning to outpace current production capacity.
- The Customers’ Inventories Index fell further into “too low” territory at 40.7%, a reading that historically signals continued production demand as downstream buyers need to replenish stockpiles.
- Prices Paid eased for a third straight month to 71.1% from 73.0%, but remained above 70% for the sixth consecutive month, reflecting persistent input cost pressures from tariffs and supply chain volatility.
- Fifteen of 18 manufacturing industries reported expansion, the broadest growth since the current manufacturing recovery began in January 2026.
- ISM Chair Susan Spence noted that the July reading corresponds to an annualized real GDP growth rate of 2.8%, based on the PMI’s historical relationship with economic output.
The Employment Breakthrough and What It Signals
The Employment Index’s move to 52.8% is the single most consequential data point in the July report. Manufacturing employment had been contracting for 33 consecutive months, a stretch that began in November 2023 and persisted through every phase of the current manufacturing recovery. The fact that factories were expanding output for seven straight months while continuing to shed workers created an unusual dynamic: rising production without hiring, driven by efficiency gains, overtime, and cautious workforce management.
That pattern broke in July. Sixty percent of survey panelists reported that their companies are actively hiring, while 40% indicated that managing existing headcounts remains the approach. The 3.1-percentage-point increase from June’s 49.7% reading was the largest single-month jump in the Employment Index since early 2022, and it shifted the labor market picture for manufacturing from contraction to growth in a single report.
For the Federal Reserve’s policy framework, the timing is significant. Manufacturing employment expansion is precisely the type of wage-pressure indicator that hawkish members of the Federal Open Market Committee have cited as a prerequisite for maintaining or increasing the current federal funds rate. The FOMC voted 9 to 3 at its July meeting to hold rates at 3.50% to 3.75%, with the three dissenters voting for a 0.25% increase. Manufacturing hiring entering expansion provides the hawks with new ammunition heading into the September meeting.
Philadelphia Fed President Anna Paulson reinforced that dynamic on August 4, telling CNBC that the current rate level is “mildly restrictive” and that she “needs to see progress” on inflation before supporting any change in policy direction. The ISM employment data complicates the progress narrative by introducing a new source of potential wage pressure in a sector that had been neutral to deflationary on the labor front for nearly three years.
Production and Demand Are Broadening, Not Narrowing
The July report’s strength was not concentrated in a single component. Production’s 6.3-point surge to 58.5% was the month’s largest individual move, reflecting a meaningful acceleration in factory output after several months of moderate expansion. The reading is the highest since November 2021, when post-pandemic restocking was driving elevated production levels across the sector.
New Orders at 56.7% continued a seven-month growth streak that began after four consecutive months of contraction in mid-2025. The order pipeline is deepening: Backlog of Orders jumped 4.5 points to 55.0%, crossing above the 50% threshold and indicating that manufacturers are receiving orders faster than they can fulfill them. That backlog buildup, combined with Customers’ Inventories at a very low 40.7%, creates a forward-looking demand signal that suggests production levels will need to remain elevated or increase further to keep pace.
New Export Orders also returned to expansion territory, showing improvement in overseas demand despite the tariff environment and global trade uncertainty. Imports rose to multi-year highs, which TD Economics analysts interpreted as a sign that domestic manufacturers are pulling in components and raw materials to support the production ramp-up rather than a sign of competitive displacement.
The breadth of expansion is also notable. Fifteen of 18 manufacturing industries reported growth in July, led by Machinery, Transportation Equipment, and Computer & Electronic Products. That breadth suggests the recovery is not being driven by a single sector or a narrow set of AI-related capital expenditures, though data center construction and AI infrastructure investment remain significant contributors to overall manufacturing demand.
The Price Picture Offers Partial Relief but No Resolution
The Prices Paid Index fell for the third consecutive month, declining 1.9 points to 71.1% from June’s 73.0%. The easing provides partial relief from the input cost pressures that have weighed on manufacturer margins throughout 2025 and into 2026. However, the index has remained above 70% for six straight months, a level that indicates widespread and persistent cost increases across raw materials, components, and energy inputs.
Survey respondents continued to cite tariffs, the ongoing U.S.-Iran conflict, and longer supplier lead times as the primary drivers of elevated input costs. The tariff environment has been a particularly stubborn factor: the effective tariff rate on Chinese imports has reached approximately 49%, and goods from other major trading partners face rates of 10% to 25% depending on origin and product category. Those costs flow through the manufacturing supply chain and ultimately reach consumers, contributing to the sticky inflation readings that have kept the Fed’s 2% target out of reach.
The simultaneous decline in oil prices, driven by diplomatic developments around the Strait of Hormuz, introduces a countervailing force. Lower energy costs ease one of the primary inflationary inputs for manufacturers, particularly in transportation, chemicals, and plastics. But the employment expansion introduces potential wage-cost pressure in the opposite direction, creating the kind of mixed signal environment that makes monetary policy decisions genuinely difficult to model.
What the PMI Means for the Fed’s September Decision
The July ISM report lands in a policy environment where the Federal Reserve is navigating at least three simultaneous and partially contradictory signals. Q2 real GDP growth came in at 1.5% annualized, below the 2.3% consensus estimate and down from 2.1% in Q1, suggesting the economy is losing momentum. The ISM Manufacturing PMI at 55.6% tells a different story: factory activity is accelerating, demand is broadening, and the sector is now adding workers for the first time in nearly three years. And the Prices Paid Index, while easing, remains at levels that confirm inflation is not moving toward 2% at a pace that would justify rate cuts.
The ISM’s own historical model suggests that a PMI reading of 55.6% corresponds to annualized real GDP growth of 2.8%, a figure that significantly exceeds the 1.5% Q2 GDP print. That divergence between the PMI’s implied growth rate and the actual GDP data reflects the uneven nature of the current expansion: manufacturing and AI-driven capital investment are running well ahead of the broader economy, while consumer spending, housing, and non-AI business investment are contributing less than their historical averages.
For the September FOMC meeting, the ISM data strengthens the case for holding rates at current levels rather than cutting, while also providing marginal support for the three dissenters who voted to raise rates in July. The employment breakthrough is the key variable. If the August ISM report, due September 1, confirms that manufacturing employment expansion is sustained rather than a one-month anomaly, the debate at the September meeting could shift from “hold versus cut” to “hold versus hike,” a framing that would represent a meaningful change in the policy conversation.
FAQs
What Does an ISM Manufacturing PMI of 55.6 Mean?
A PMI reading above 50% indicates manufacturing expansion; below 50% signals contraction. The July reading of 55.6% is the highest since May 2022 and marks the seventh consecutive month of expansion. ISM estimates that a reading at this level historically corresponds to annualized real GDP growth of approximately 2.8%.
Why Is the Employment Index Move Significant?
The Employment Index rose to 52.8% in July, entering expansion territory for the first time in 33 months. The shift signals that manufacturers are actively hiring rather than managing headcounts through attrition or overtime, introducing a new source of potential wage pressure that complicates the Federal Reserve’s inflation outlook.
How Does This Data Affect the Federal Reserve’s Rate Decision?
The ISM report strengthens the case for holding rates at the current 3.50% to 3.75% range and provides marginal support for the three FOMC members who voted for a rate increase in July. Manufacturing employment expansion is the type of labor market signal that hawkish Fed members have cited as a prerequisite for maintaining or tightening policy.
Are Input Costs Still Rising for Manufacturers?
The Prices Paid Index eased to 71.1% from 73.0%, its third consecutive monthly decline. However, the index has remained above 70% for six straight months, indicating that input costs are still rising broadly. Respondents cited tariffs, the U.S.-Iran conflict, and extended supplier lead times as primary cost drivers.